
Key Tools and Skills for Data Science
How many tools does one have to master in order to call herself a data scientist? And what are those tools? If you’re just entering the field, it may seem like the list is ridiculously long. Googling “data science tools” spits out articles like “TOP 50 data science tools”, and asking it on the Internet will get you flooded with opinions. That’s overwhelming and, frankly, can contribute to discouraging someone from even trying. So how does one decide? I can’t speak for everyone, but I can share my thought process on this, and yep, it is yet another opinion :D I hope it resonates with you.
To code or not to code?
From a bird’s eye view, it appears that the data science tools form two rather distinct clusters:
- Tools requiring technical expertise - you need to know how to program or be willing to learn
- Drag’n’drop data science tools - no coding skills required
If you never studied any programming languages, it may be tempting to go for drag’n’drop tools (e.g. Tableau). They give nice and no-sweat out-of-the-box data visualizations, and in most cases make it easy to import your data and play with it.
However, tools like that typically aren’t free, they have limitations when it comes to messy nested data, and there’s a good chance that you will end up needing some coding skills after all either for exploratory data analysis, or data wrangling, or web scraping, dealing with streaming data or putting a model into production. Also, once you have acquired certain level of coding skills, figuring out how to use a drag’n’drop tool (if you need to) will not take much of your time.
So, summing up, my personal choice here is to learn to code first.
Python or R?
While, of course, there are other programming language you can use for data science purposes, like Julia, Scala, Java or Kotlin, Python and R remain the most popular choices.
Both languages have been around since early 90s. R has been developed by statisticians for statisticians, and it was designed to make data analysis and statistics easier to do. Python is a general purpose language, and thus offers more flexibility. It suits better scenarios where the results of data analysis need to be put in production, not only visually presented.
R has a steep learning curve for those who are new to programming (not the case for experienced programmers), while Python is considered a good starting language for those who wish to learn to code.
R is often praised for rich package ecosystem, and specifically its visualization capabilities. Python has a number of libraries for data manipulation, analysis and machine learning that are comparable, and there has been a lot of progress in visualization tooling (e.g. seaborn and Bokeh).
Python has seen some great deep learning libraries emerge like TensorFlow, and Keras. R has deepnet and there are R interfaces to TensorFlow and Keras.
At a first glance it may seem like there’s a tie between the two, but Python has been growing rapidly, and while a few years ago it may have been catching up to R, now it’s already ahead in many ways. I personally prefer Python, as it is easy to learn, allows to do a lot more than Data Science and Machine Learning, and has an impressive set of libraries for all things Data Science.
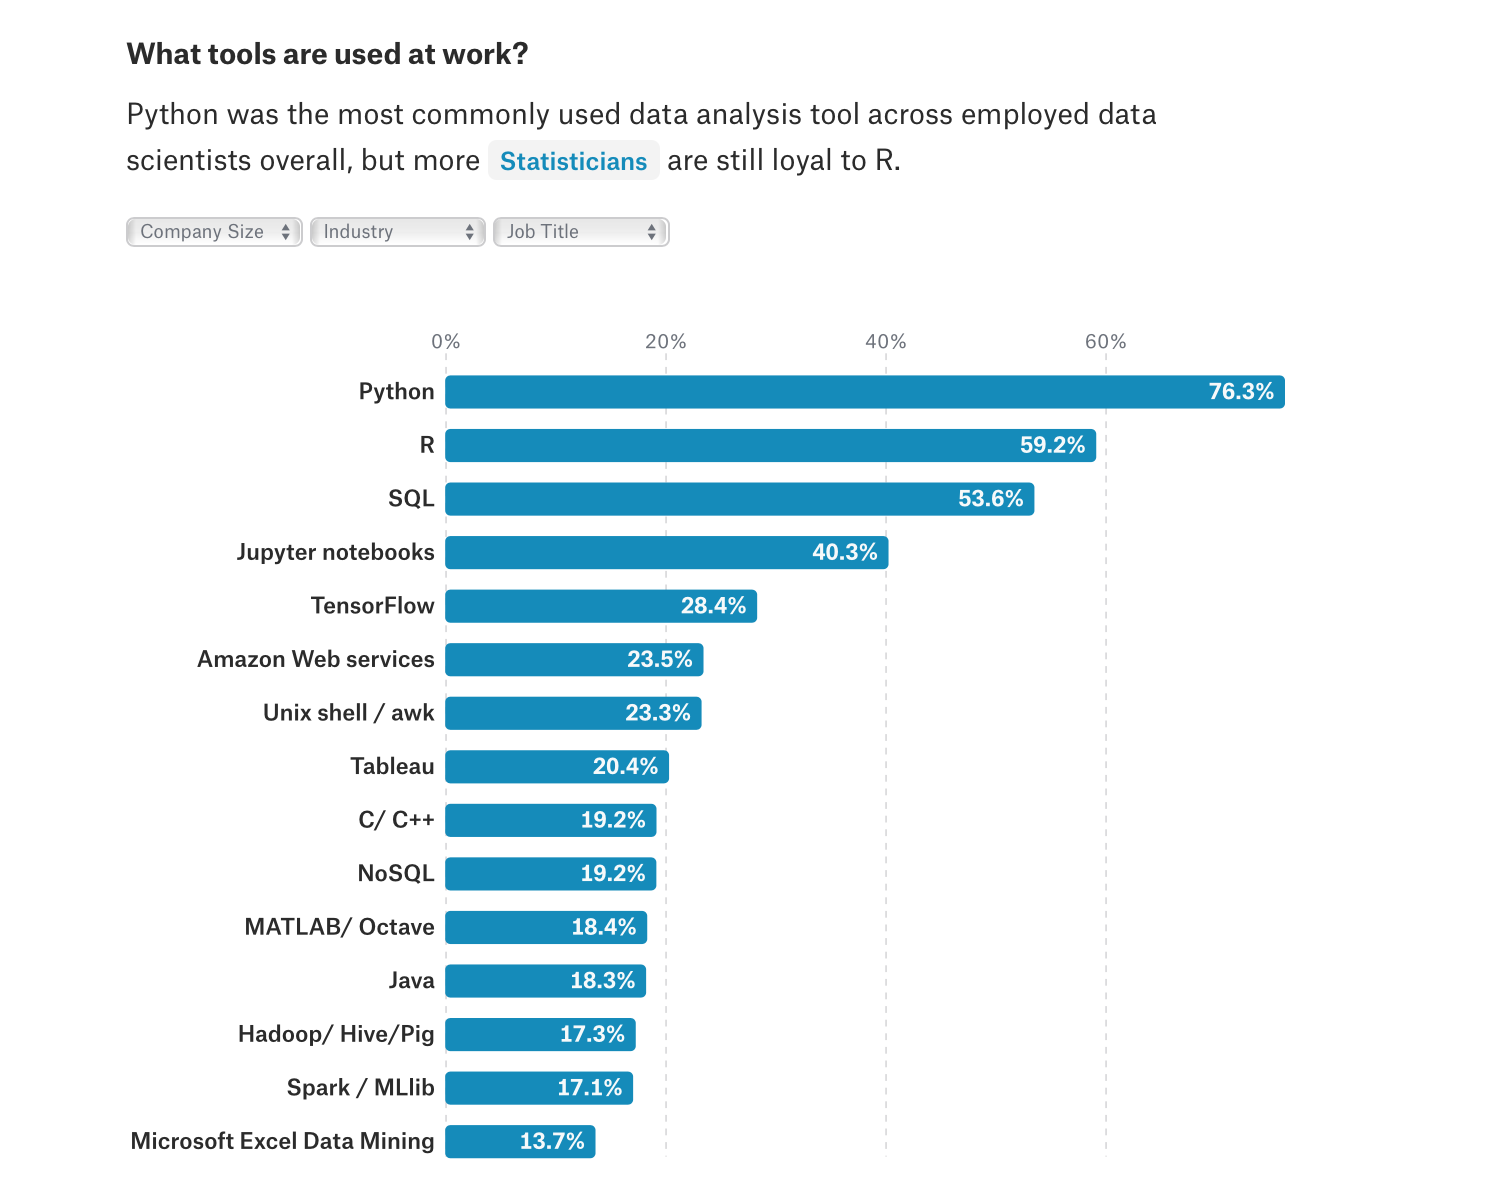
And the majority of data scientists tend to lean more towards Python. In Kaggle’s 2017 Machine Learning and Data Science survey Python was named as the most commonly used tool (with the trend continuing in 2018, check out their 2018 survey raw data):
Recent JetBrains’ Data Science Survey also portrays Python as the leader programming language for data analysis:

Moreover, according to Kaggle’s survey, 63.1% or respondents agree that newcomers to Data Science should learn Python. At the same time, JetBrains Data Science survey shows that 56% or respondents believe that Python will remain on top for the next 5 years.
Now, I believe that makes a good case for Python. Let’s quickly go through the essential libraries any data scientist using Python needs to be comfortable using.
Essential Python Libraries
NumPy
NumPy is the fundamental package for scientific computing with Python. Think of it as of a godfather for data manipulation libraries in Python. NumPy arrays are much more efficient at storing data and operating on it compared to standard Python methods, which is why nearly all of the data science ecosystem in Python is build on top of NumPy. It is well worth the effort to spend some time learning NumPy regardless of what sort of data science tasks you intend to tackle.
pandas
pandas is a data manipulation package built on top of NumPy. It gives you some useful data structures - Series (1-dimensional) and DataFrame (2-dimensional), that cover the majority of typical data munging use cases. With pandas you can read/write data in different formats, combine multiple datasets together, easily select even complex subsets of your data, make calculations across rows, columns or subsets, find and handle missing data, and much more. Pandas is great for wrangling and cleaning data, exploring it, and organizing the results of the exploratory data analysis into a form suitable for plotting.
matplotlib
Matplotlib is a multiplatform 2D plotting library. It allows you to generate plots, histograms, bar charts, errorcharts, scatterplots, and other types of visualizations with just a few lines of code. It’s great for plotting when exploring your data but it is a little dated and starts to feel clunky a bit. If you want smoother looking visualizations to present the results of your work, you should also look into seaborn and Bokeh visualization libraries.
scikit-learn
https://scikit-learn.org/stable/
scikit-learn is a machine learning library that offers implementations of various machine learning algorithms for classification, regression, clustering, and so on. It also gives you means for preprocessing your data (for instance, feature normalization), dimensionality reduction, fine-tuning hyperparameters of your models, and so on. Of course, if you want to efficiently use this library, you need to understand these Machine learning algorithms and techniques. Luckily, scikit-learn has great documentation with a lot of examples. Kudos to the authors!
TensorFlow
TensorFlow is your step towards the part of Data Science where most of the hype is - the Deep Learning. Of course, you technically can build a neural network using only NumPy, but Tensorflow will be faster, probably less buggy, and you won’t need to implement back propagation yourself. If you want even more abstraction, there’s keras on top of Tensorflow.
More tools!
Jupyter Notebooks
The Jupyter Notebook web application built on top of IPython that allows you to create, interactively run, and then share documents that contain code, equations, visualizations and markdown text. You can use them for data cleaning and transformation, statistical modeling, data visualization, machine learning, and so on. They are widely used and the combination of inline plots, code and markdown is really nice for presenting your findings. However, be sure to learn Jupyter well and be aware of the hidden state that notebooks have. It’s really easy to screw things up! If, for instance, you start running cells out of order you can no longer rely on the outputs of the cells. I know I had my share of confusion with notebooks.
SQL
A lot of times, to get your data you’ll need to be able to write and execute queries in SQL (structured query language) to extract data from a database. Being proficient in SQL will help you access data, and get insights into it. Some data warehouses, like Google’s BigQuery, now even allow you to create and execute machine learning models using SQL queries.
PyCharm
https://www.jetbrains.com/pycharm/
Jupyter is absolutely fine for tinkering with data and presenting visualizations to stakeholders. However, once you reach the point when you need to put your code in production, Jupyter Notebooks simply don’t cut it. You can convert a notebook to a .py file but that alone won’t cut it. To make it into a working script or even a package, you’ll have some refactorings to do. Then, you will probably want to add some tests, possibly get your code on GitHub to collaborate with your teammates. These are the things where an IDE can be super helpful. Plus, it’ll give you a lot of other smart features like code completion.
As you may or may not have noticed I’m not even touching on all the big data zoo of tooling in this post. I have two reasons for doing so: a) I feel quite new to the big data scene (as of now), and b) this post already contains quite a list of tools that one needs to get comfortable with, and it seems to be enough for a start. Don’t worry, by the time you master all these, there will be more tooling to get to know! :)
Skills
Statistics
Statistics is an important part of Data Science. That is, of course, if you want the conclusions you draw from the data not to be complete rubbish. So if you’re coming to Data Science without statistics studies in your background, or if you feel you may need to refresh your knowledge, please do put some time into learning at least the essentials: here’s a free copy of “Introductory Statistics” from openstax.
PS: At first, I didn’t intend to include Statistics here because I thought it was super obvious how fundamental it is, but then this picture appeared on my radar which clearly shows it’s not that obvious to all.

Programming
Didn’t I already talk about coding? Well, yes, and no. Basic Python knowledge may be enough for poking at data in a Jupyter notebook, but understanding the language and programming concepts better comes a long way and will become crucial if you get to put your Machine Learning models in production. Learn about OOP, design patterns, unit testing, and coding best practices.
Communication
Data scientists do not exist in a vacuum. You have to be able to report the technical findings in a clear and fluent way to the stakeholders, so that appropriate actions could be taken based on your analysis. If you want to improve your visual communication skills, I recommend reading “The Truthful Art | data, charts and maps for communication” by Alberto Cairo.
If you got to this part of this post, first of all - thanks for bearing with me! It has been a long read :D Second of all, come back soon ;) In my next posts I plan to take a closer look at Jupyter notebooks, and write about using pandas for wrangling data.